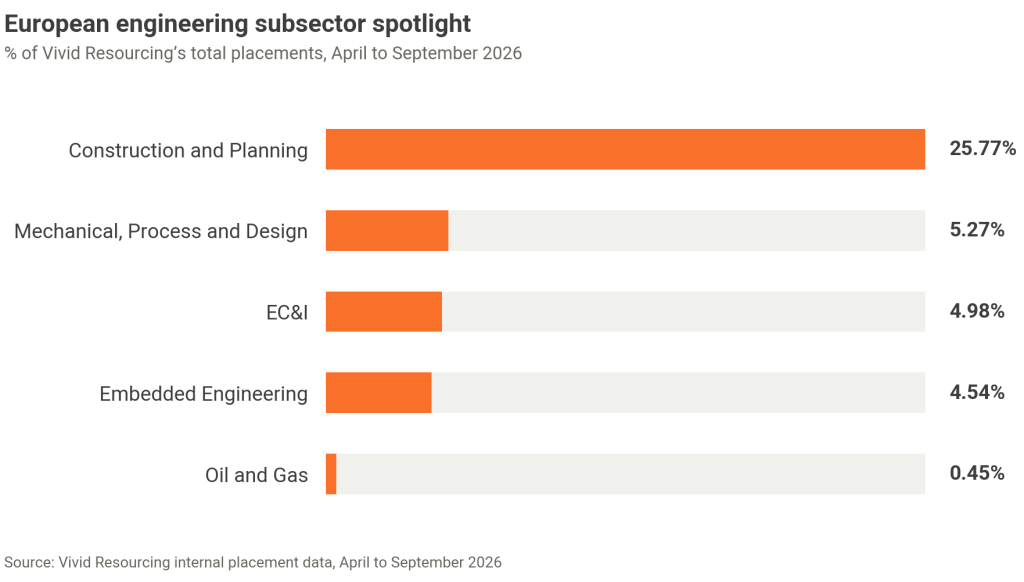
Energy independence remains a key priority for European markets. This has triggered a substantial rise in investment into alternative fuels; in particular LNG as a short-term solution and hydrogen as a long-term pathway.
The construction of new terminals, storage facilities and hydrogen-ready infrastructure has created opportunities across every core discipline, from EPC management to commissioning and HSE.
The construction of new terminals, storage facilities and hydrogen-ready infrastructure has created opportunities across every core discipline, from EPC management to commissioning and HSE.

The main drivers behind large-scale engineering projects are energy independence, environmental compliance and data centre expansion. This is creating demand for upgrades to existing industrial sites, greenfield renewable energy projects such as BESS sites and substations, and new data centres with supporting energy infrastructure. As a result, clients across the project lifecycle, from client-side teams to EPC(M)s and contractors, are seeking site supervisors, project and construction managers across multiple disciplines, particularly electrical and civil engineering, alongside HSEQ professionals.

Energy transition for many European countries away from the traditional fossil fuel power and storage plants has been a big focus this year.
The construction of more sustainable energy sources such as Solar, BESS, Waste to Energy has created a fast growing market for EPC contractors creating new jobs for white and blue collar construction professionals.
The construction of more sustainable energy sources such as Solar, BESS, Waste to Energy has created a fast growing market for EPC contractors creating new jobs for white and blue collar construction professionals.

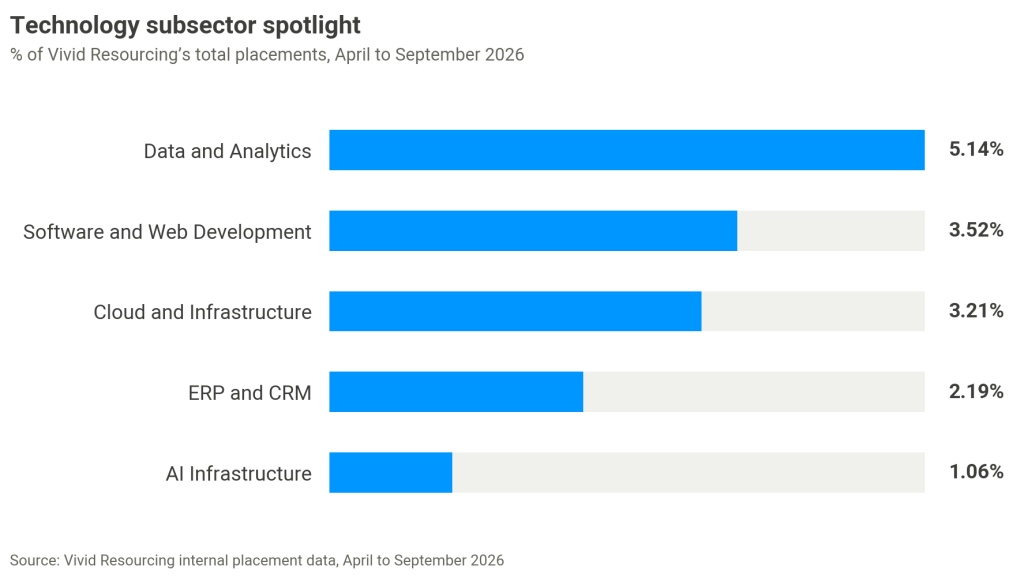
We're in the middle of a big shift in the IT landscape. Companies are rolling out major AI developments, getting their data in order and facing a growing risk of cybersecurity incidents.
As a result, the market for Data, AI and Cybersecurity consultants keeps growing.
As a result, the market for Data, AI and Cybersecurity consultants keeps growing.

An issue businesses are increasingly running into is finding project managers who have undeniable development skills and can then pair that with the ability to manage a team with commercial outcomes in mind as their driver. Knowing which people can bridge the gap between business and technical is in my opinion the greatest reason for prospective clients asking for my assistance

Lorem ipsum dolor sit amet, consectetur adipiscing elit. Ut elit tellus, luctus nec ullamcorper mattis, pulvinar dapibus leo.

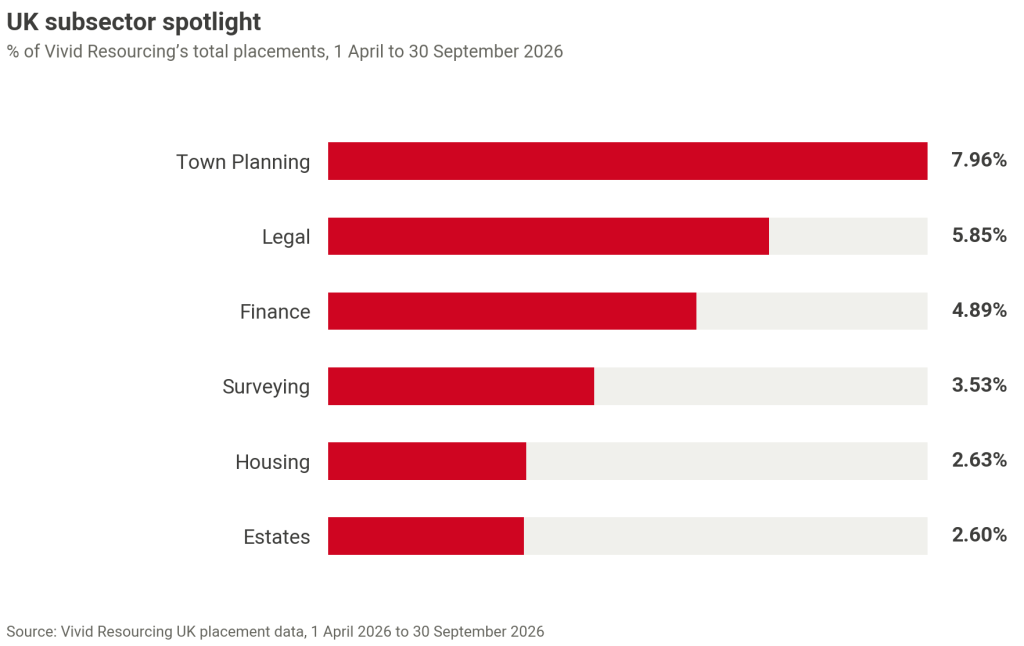
Governance and strategic legal recruitment featured prominently in the Government Legal market throughout H1 2026, amid uncertainty around Local Government Reorganisation (LGR). Client conversations indicate continued demand for senior legal expertise, with councils relying on experienced professionals to support governance, advise on complex strategic matters and navigate an evolving local government landscape, despite pauses to reorganisation plans in many areas.

Residential development and urban regeneration remain areas of steady growth across the UK, while Grid Reforms have created uncertainty in renewable energy. Client conversations suggest residential demand remains strong, although securing land agreements is a key challenge. Renewable energy is still seen as the future, but uncertainty around when the market will shift is leaving some planners unsure of their next steps. For candidates, a strong pipeline of work remains a major selling point.